My Projects
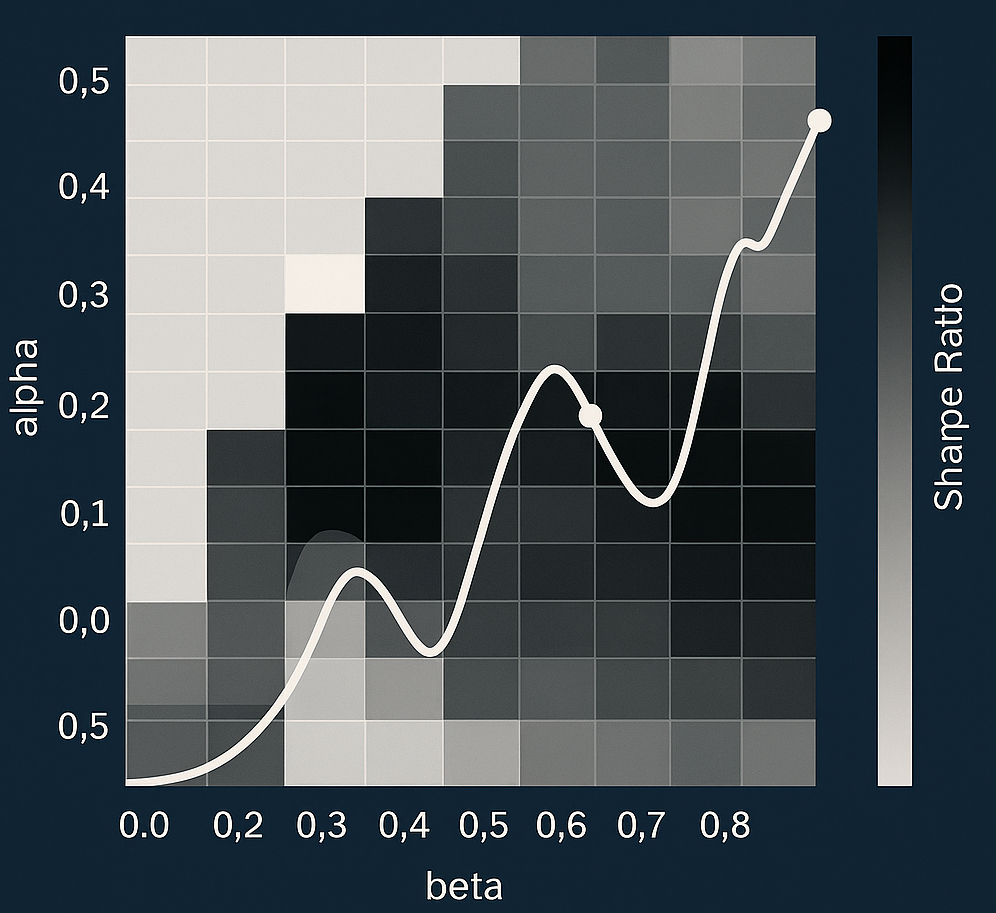
A fully reproducible quantitative research project analyzing USD/CAD trend persistence using dual exponential smoothing filters. I built a complete forecasting and trading pipeline: signal engineering, α–β parameter tuning, long/short asymmetry testing, buffer and deceleration exit experiments, backtesting, Sharpe evaluation, and trade-level accuracy modeling. This project demonstrates my capabilities in quantitative analysis, data science workflow design, mathematical modeling, statistical reasoning, and technical communication.
📌 Project Summary
Objective: Build a trend-following FX trading system for USD/CAD using dual exponential smoothing filters (ESα, ESβ) and evaluate long/short symmetry, parameter sensitivity, and exit logic.
Methodology: Designed full pipeline including parameter grid search, regime-specific performance evaluation, trade-level accuracy analysis, and experiments on buffer thresholds and deceleration-based exits.
- Dual ES crossover signals with α < β
- Trade-level performance aggregation (not just daily returns)
- Long-only vs short-only optimization
- Buffer & deceleration exit experiments
Key Results:
- Optimal parameters:
α = 0.20,β = 0.60 - Sharpe ratio improves 0.26 → 0.45
- Trade-level accuracy ≈ 73%
- Distance buffer & deceleration exit reduce performance
See full technical report below.
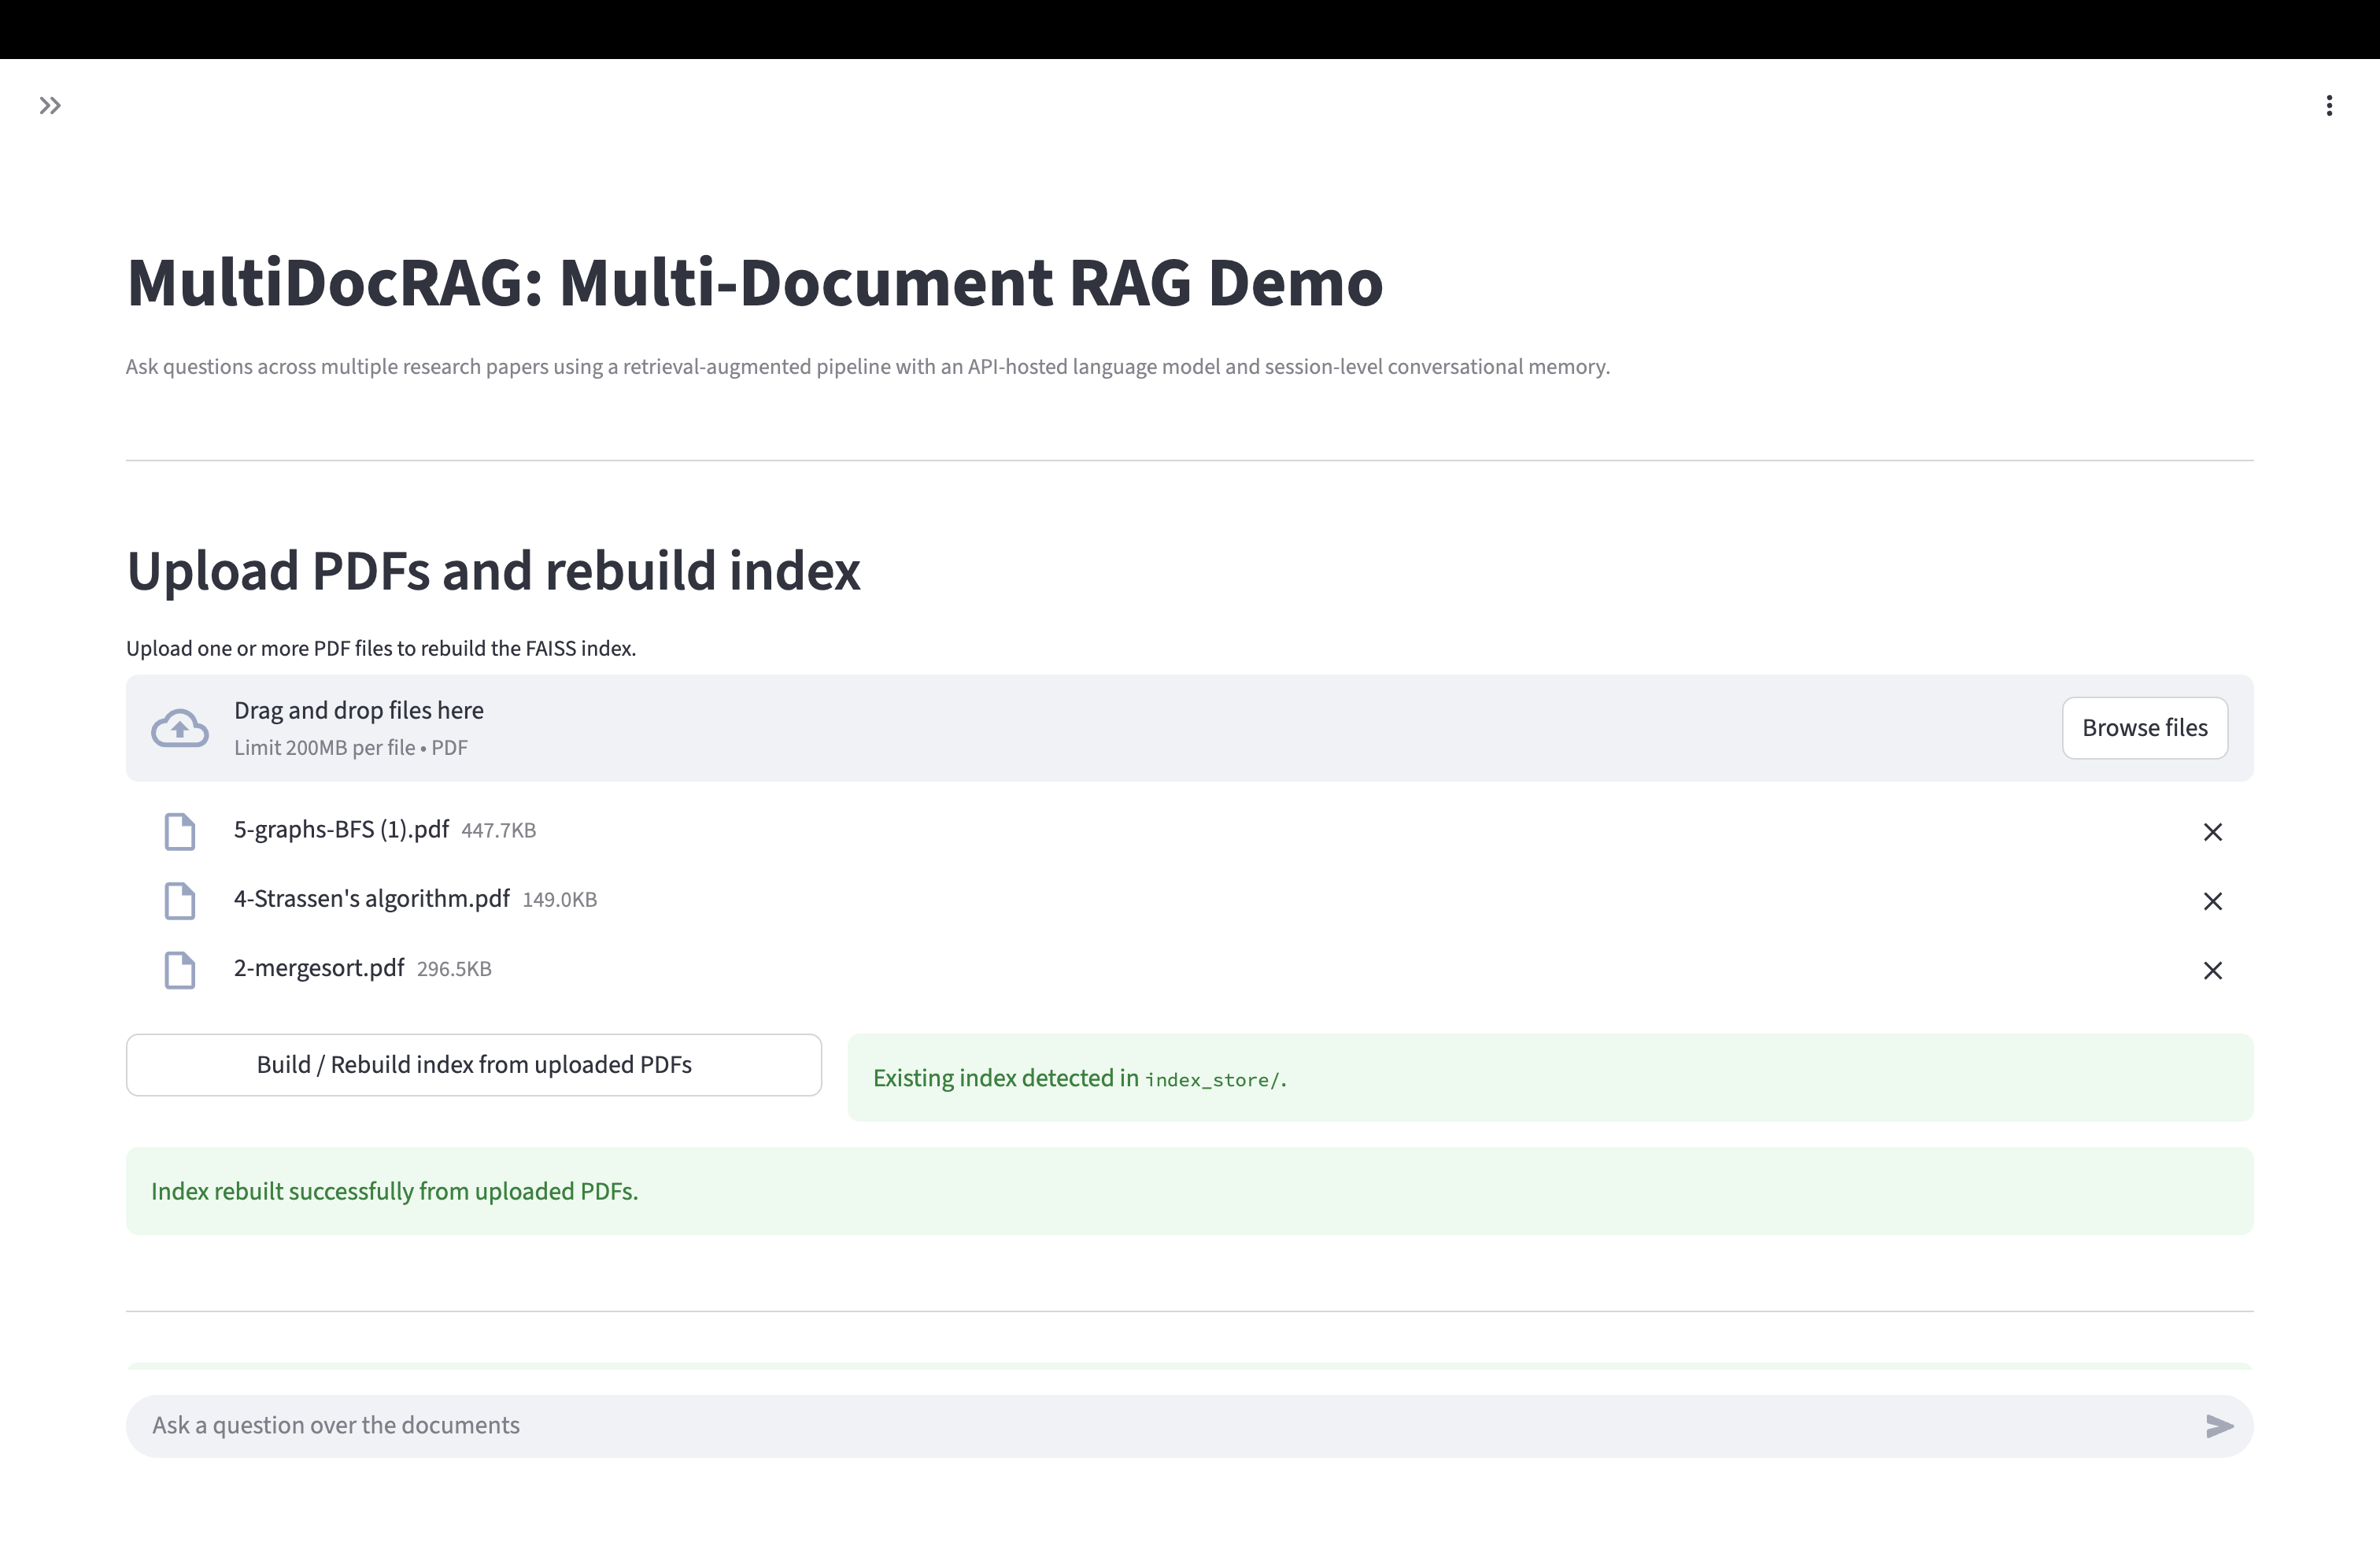
A full-stack retrieval-augmented generation (RAG) system designed to perform multi-document reasoning across uploaded PDFs. The system supports scalable document ingestion, semantic chunking, vector search retrieval, transparent evidence inspection, and automated evaluation. This project demonstrates my ability to integrate LLM engineering, applied machine learning, data pipeline design, evaluation methodology, and end-to-end product prototyping.
📌 Project Summary
Objective: Build an AI assistant that can perform cross-document synthesis and answer questions using grounded, evidence-retrieved context from multiple PDFs.
System Design: Implemented an end-to-end pipeline including:
- Multi-PDF ingestion and cleaning
- Sliding-window chunking with semantic overlap
- Embedding generation via Sentence-Transformers
- FAISS vector search retrieval with score transparency
- LLM reasoning layer with contextual grounding + controlled refusals
- Automated evaluation framework across correctness, groundedness, and refusal safety
- Streamlit demo UI with prompt inspection and retrieval visibility
Applications:
- Cross-document analytics for research & reporting
- Policy / business intelligence synthesis across multiple PDFs
- Technical documentation QA and comparison
- Automated literature review
What This Shows About My Skillset:
- Ability to design end-to-end ML/LLM systems
- Strength in data engineering workflow (cleaning → chunking → indexing → retrieval)
- Evaluation methodology formulation and metric-driven iteration
- Full-stack prototyping (backend + model + frontend UI)
- Clear communication of system design and reasoning behavior
Current Progress:
- Core ingestion, chunking, and vector retrieval implemented
- LLM reasoning module integrated with memory + grounded prompting
- Automated evaluation pipeline complete (27-question benchmark)
- Live demo deployed via HuggingFace Spaces
- Full report available
This project is actively evolving as I benchmark, refine prompts, evaluate failure modes, and introduce reranking & improved LLM backends.
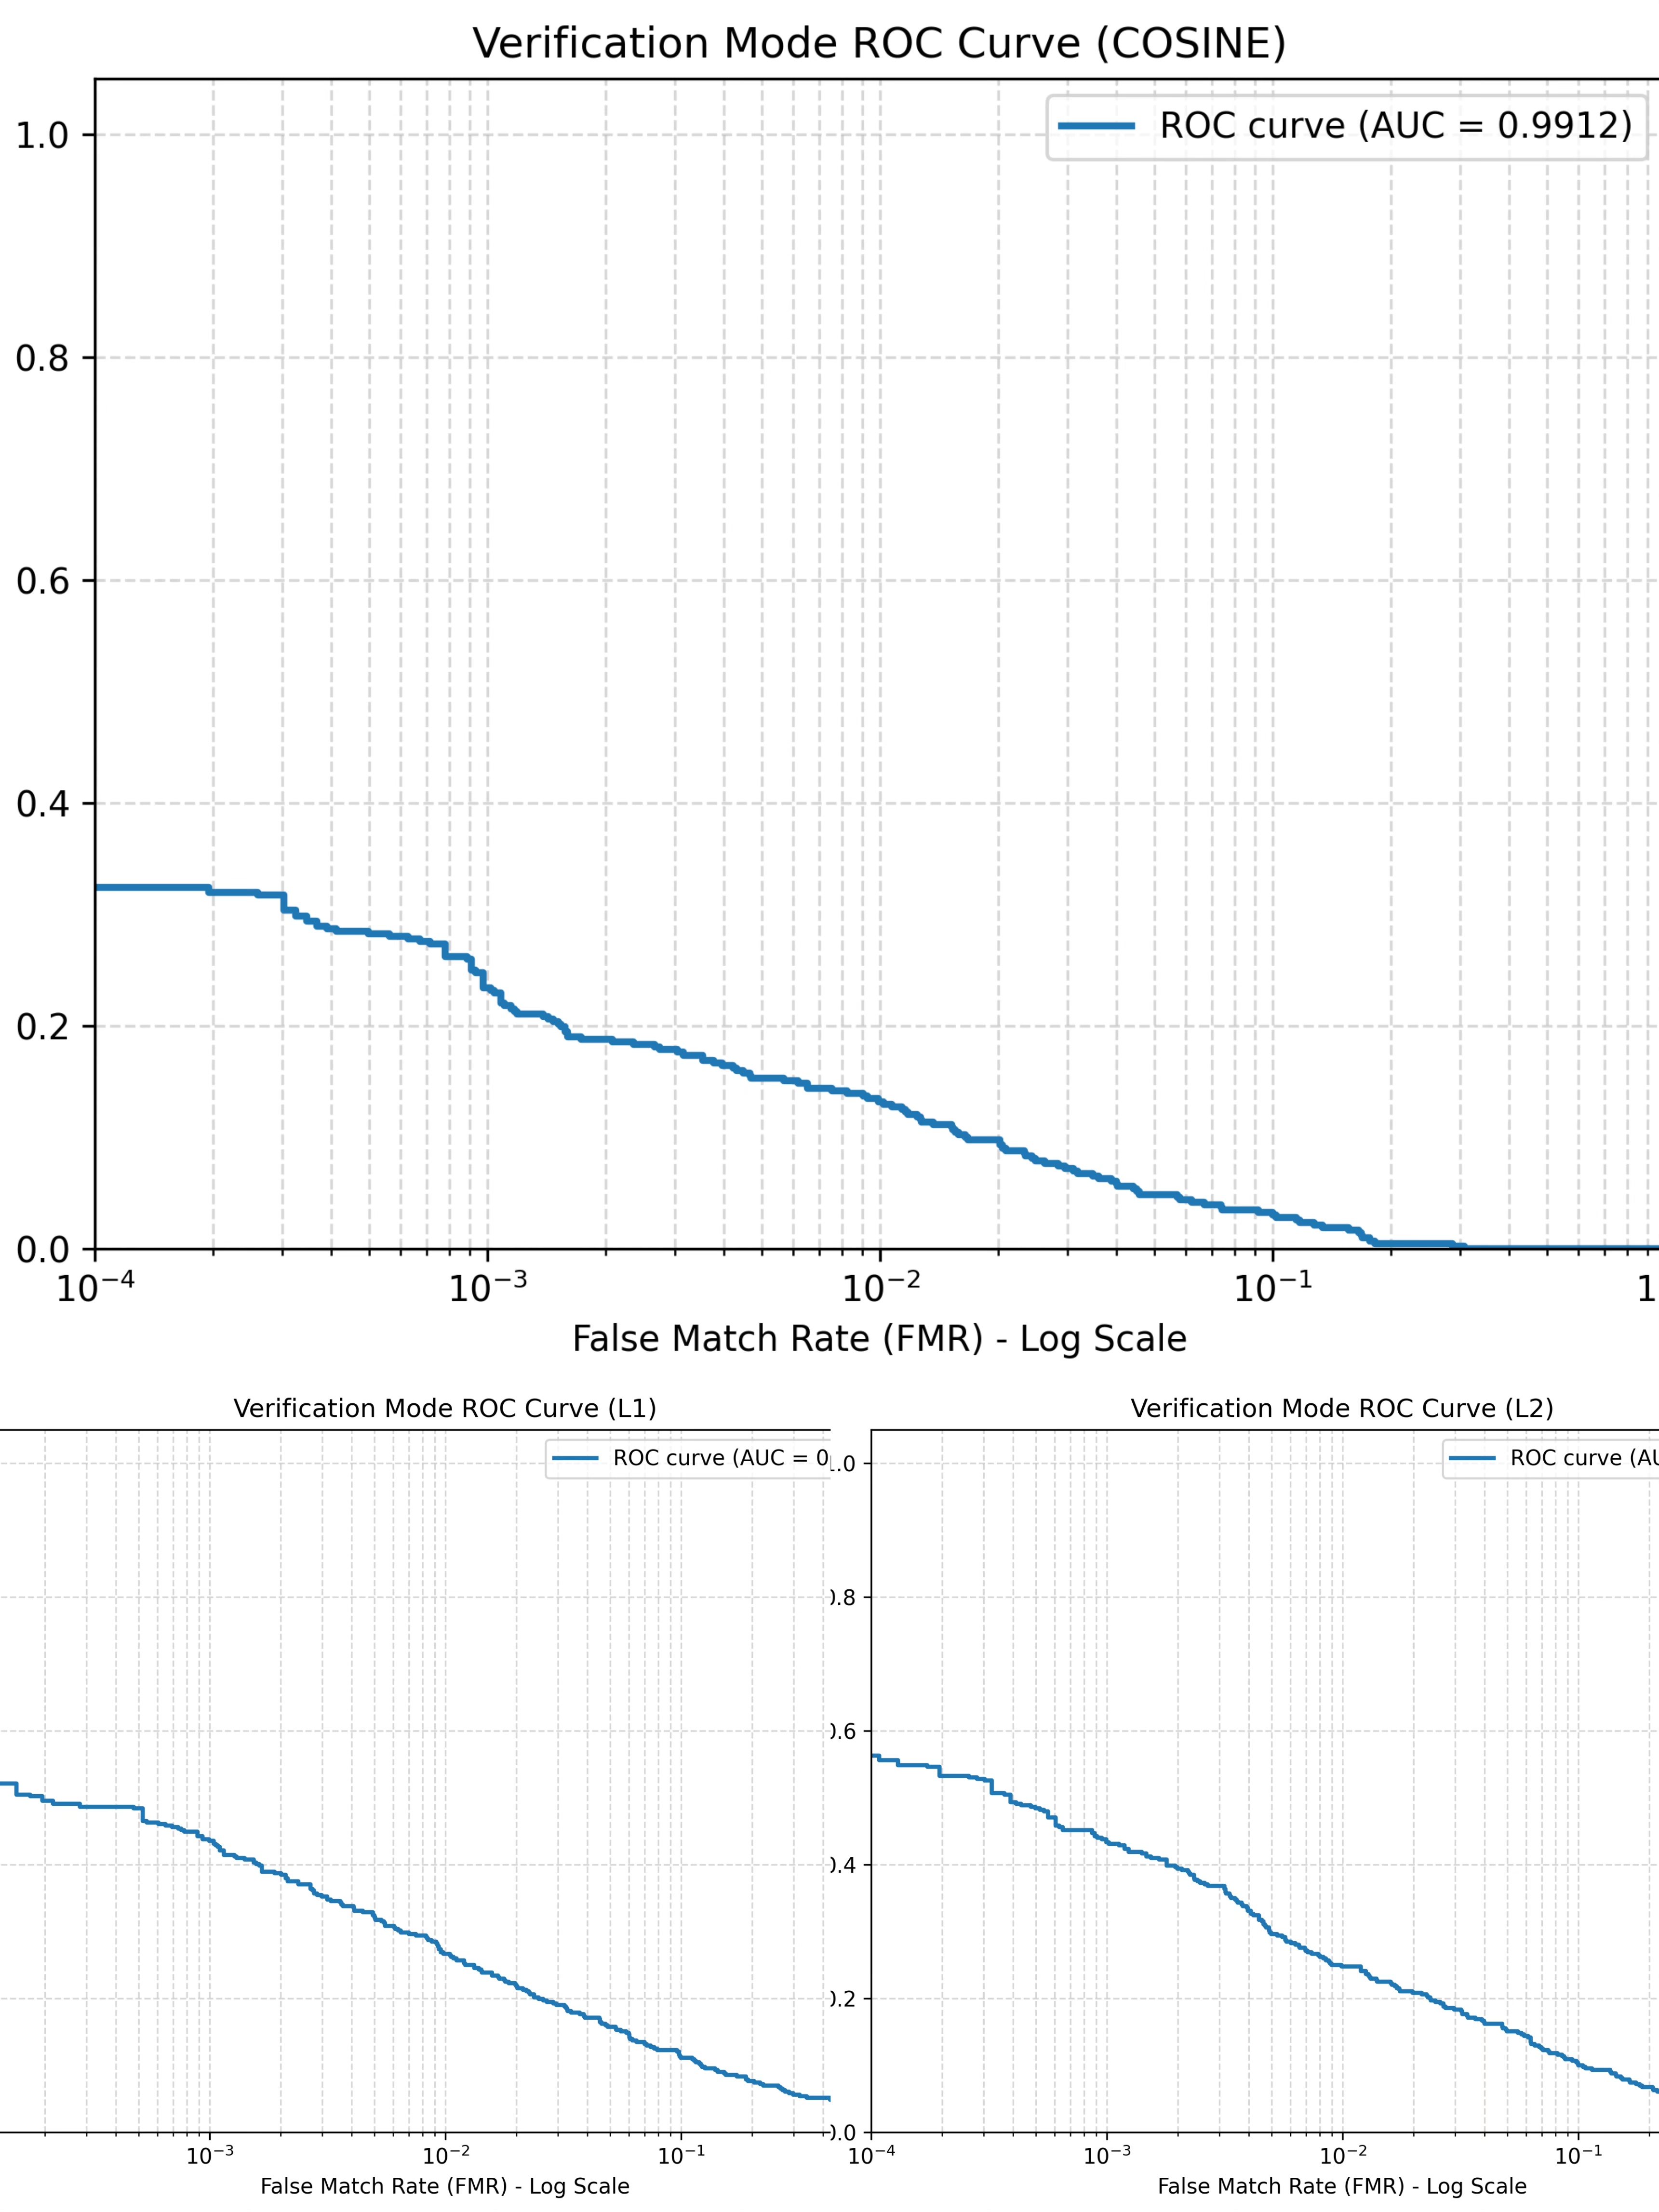
A full computer vision and pattern recognition pipeline for iris-based biometric identification, implemented as a Columbia University course project based on Ma et al. (2003). I built and refined an end-to-end system including iris localization, normalization, image enhancement, handcrafted feature extraction, PCA + Fisher Linear Discriminant matching, and verification/identification evaluation. This project demonstrates my ability in computer vision, machine learning system design, mathematical modeling, experimental debugging, evaluation methodology, and technical implementation.
📌 Project Summary
Objective: Reproduce and refine a complete iris recognition system based on Ma et al. (2003), using the CASIA-IrisV1 dataset under a fixed training/testing protocol.
System Design: Implemented an end-to-end modular pipeline including:
- Iris localization using projection minima, thresholding, contour analysis, and Hough circle detection
- Non-concentric rubber-sheet normalization into a fixed-size rectangular iris representation
- Image enhancement through background illumination correction and local histogram equalization
- Handcrafted texture feature extraction using two circularly symmetric spatial filters
- Block-wise statistical encoding (Mean + Average Absolute Deviation) into a 1536-dimensional feature vector
- PCA + Fisher Linear Discriminant (FLD) for dimensionality reduction
- Nearest-center / multi-template matching with L1, L2, and cosine distance metrics
- Performance evaluation through CRR and verification ROC curves
What problem I solved:
- Turned raw grayscale eye images into a reproducible recognition pipeline rather than a single classifier
- Handled geometric variation through normalization and rotation-aware template matching
- Reduced sensitivity to illumination and local noise through enhancement and block-level feature design
- Improved performance through iterative debugging of ROI selection, matching strategy, and evaluation protocol alignment
Key Results:
- Original Space CRR: L1 = 73.38%, L2 = 71.99%, Cosine = 73.38%
- Reduced Space CRR: L1 = 80.79%, L2 = 81.25%, Cosine = 86.11%
- Verification ROC AUC: L1 = 0.9476, L2 = 0.9555, Cosine = 0.9912
- Reduced-space matching substantially outperformed original-space matching
- Cosine distance produced the strongest final identification and verification performance
What this shows about my skillset:
- Ability to implement a full ML / CV pipeline from raw data to final evaluation
- Strong debugging and iteration skills guided by metrics rather than guesswork
- Experience translating research-paper methodology into working code
- Comfort with classical machine learning, feature engineering, and experimental analysis
- Ability to structure technical projects in a modular, reproducible way
This project was completed as a Columbia University course project and reflects both technical implementation and iterative performance improvement under a fixed experimental protocol.
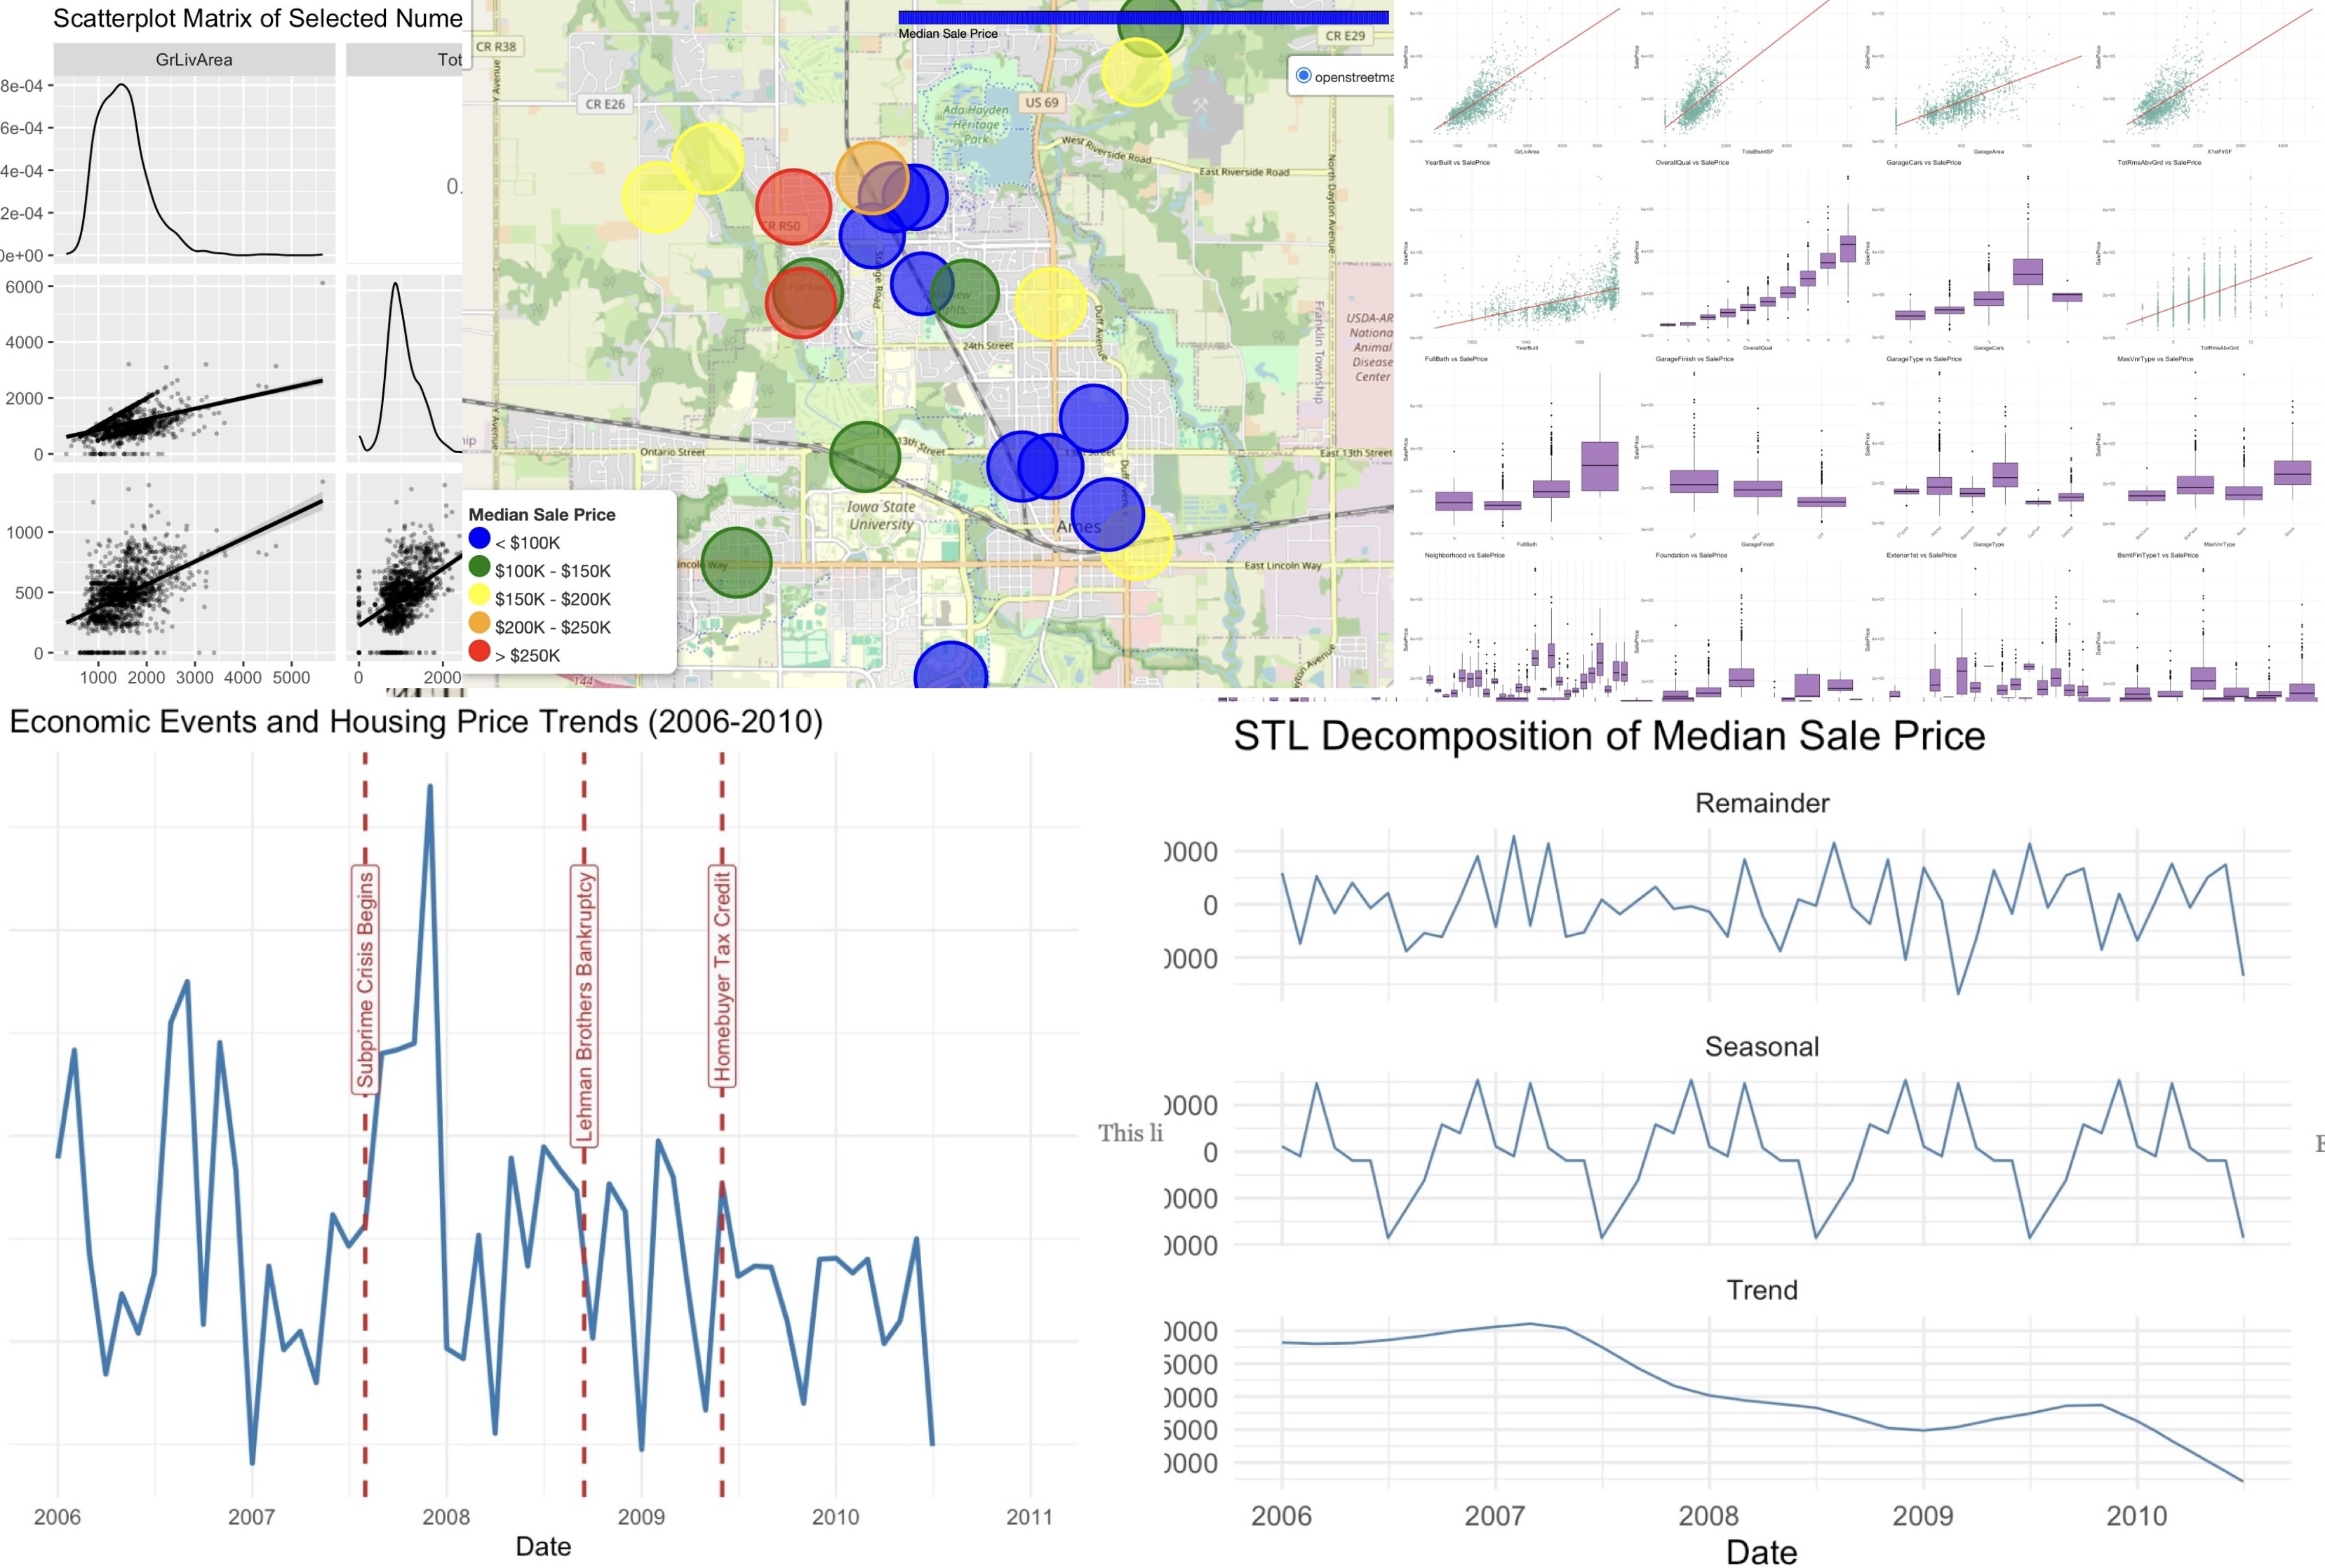
Built a housing price prediction pipeline using exploratory data analysis, feature engineering, and regression/ML models including Ridge, LASSO, Random Forest, and Group LASSO. The models achieved strong predictive accuracy while consistently identifying space, quality, and utility as the key drivers of value. Beyond forecasting, the project emphasized interpretability and stakeholder communication — turning high-dimensional data into actionable insights for decisions.
📌 Project Summary
Objective: Build an interpretable housing analytics pipeline that identifies economic drivers of value — not just produce a black-box prediction model.
Methodology: Starting from the full Ames dataset (80+ variables), we:
- Separated numeric vs categorical features & re-classified ordinal variables (
OverallQual,MoSold) - Used correlation + effect size (η²) to evaluate predictor strength
- Applied adjusted GVIF to control multicollinearity
- Built interactive visualizations: heatmaps, neighborhood maps, STL trend decomposition
Key Insights:
- Space & construction quality are the dominant drivers (
GrLivArea,TotalBsmtSF,OverallQual) - Neighborhood effects persist even after controlling for features
- Garage & exterior finishing add second-tier but significant value
- Time-series structure aligns with macro events (e.g., subprime crisis, tax credits)
What this demonstrates:
- Ability to turn raw municipal data into decision-oriented insights
- Bridging EDA → feature engineering → modeling → communication
- Transferable to pricing, risk modeling, and applied analytics pipelines
Full interactive analysis available below.
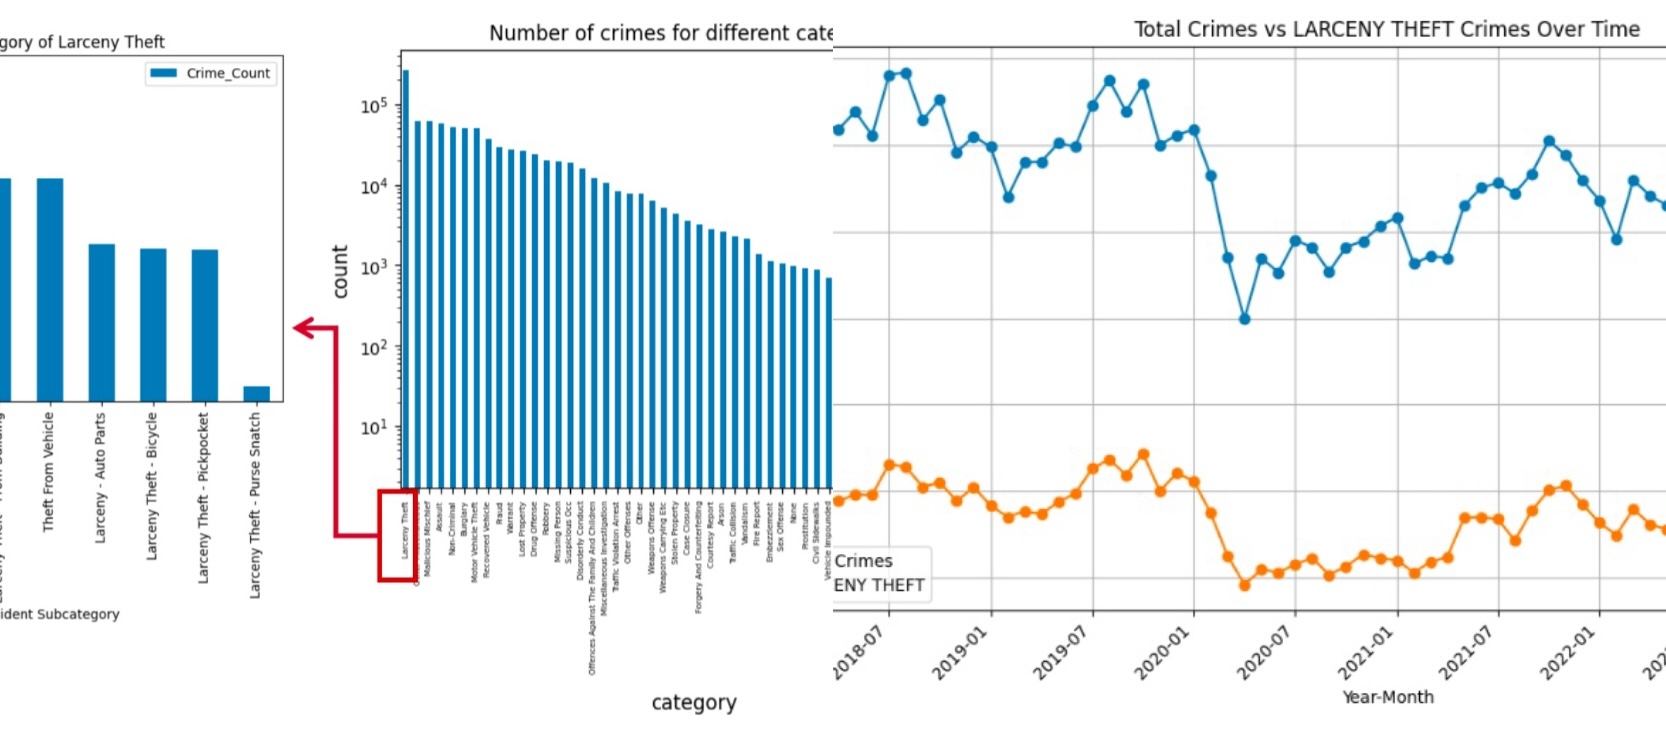
Built a large-scale spatial econometrics pipeline linking 900k+ SF police incident records with ACS socioeconomic panel data. Applied fixed-effects logistic models, Poisson/NegBin count models, and time-series forecasting to quantify how inequality, unemployment, and mobility patterns shape crime trends. The project demonstrates skills in causal inference, longitudinal modeling, data integration, and policy analytics—transferable to business forecasting & systems design.
📌 Project Summary
Objective: Quantify whether crime patterns are driven by economic factors such as inequality, unemployment, transit patterns, and demographic changes.
Pipeline: Merged 913,732 incident-level crime records with census-tract ACS data (2017–2022) using spatial joins and longitudinal panel construction.
- Panel structure: tract × year
- Models: Fixed-effects logistic (individual), Poisson/Negative Binomial (aggregate)
- Time-series forecasting using ARIMAX/SARIMAX
- Feature engineering for economic deltas + mobility metrics
Key Findings:
- Higher transit usage (public transit, cycling) → consistent increases in crime rates across categories
- Income inequality + unemployment negatively associated with crime at tract level (counter-intuitive, suggests urban confounds)
- Bachelor’s degree rate reduces violent/public order crime but increases property crime
- COVID years: fewer public order crimes, more property crimes
Methodological Insights (Transferable):
- Importance of panel vs individual-level inference: aggregate models outperform individual classifiers
- Negative Binomial superior under over-dispersion → similar logic applies to ops forecasting
- Mobility + density better predictors than pure economic indicators
Full methodology and regression tables available in report below.

A handcrafted, single-page microsite that turns my Ikebana course portfolio into an immersive digital experience. Built from scratch (no frameworks) with responsive layout, CSS animations, JavaScript-driven interactions, and background audio integration, this project reflects my attention to detail in UX, visual hierarchy, and front-end systems thinking rather than just static pages.
📌 Project Summary
Objective: Design and implement a small, self-contained web experience that presents Ikebana work in a way that feels more like a product than a static gallery — with smooth transitions, responsive layout, and ambient audio.
What I built:
- A fully responsive single-page site that adapts to different screen sizes and dark/light environments
- Custom CSS animation system (entrance transitions, hover states, text reveals) without external libraries
- JavaScript controllers for navigation, scroll-based effects, and HTML5 audio playback
- A layout that balances photography, text, and whitespace so the site reads like a curated story rather than a code demo
Why it matters for my broader work:
- Shows I can go from concept → UX structure → visual design → implementation on my own
- Reinforces skills that are directly reusable for analytics dashboards, internal tools, and stakeholder-facing UIs
- Demonstrates that I care about the last mile of data/insights — how people actually experience what we build
Below are selected screenshots from the live site.